AI Security Gateway - Enterprise Integration Guide
This document provides comprehensive guidance for configuring enterprise integrations with SIEM, Slack, and email systems for real-time security alert forwarding and incident management.
Integration Overview
The AI Security Gateway supports multiple enterprise integrations to forward security alerts and notifications to external systems:
- SIEM Integration: Forward security events to Splunk, Elastic, QRadar, and other SIEM platforms
- Slack Notifications: Real-time alert notifications to Slack channels
- Email Alerts: Send alert summaries via email (SMTP)
- Langfuse: AI observability and tracing integration
All integrations are configured through the Web Admin Interface at Settings → Integrations.
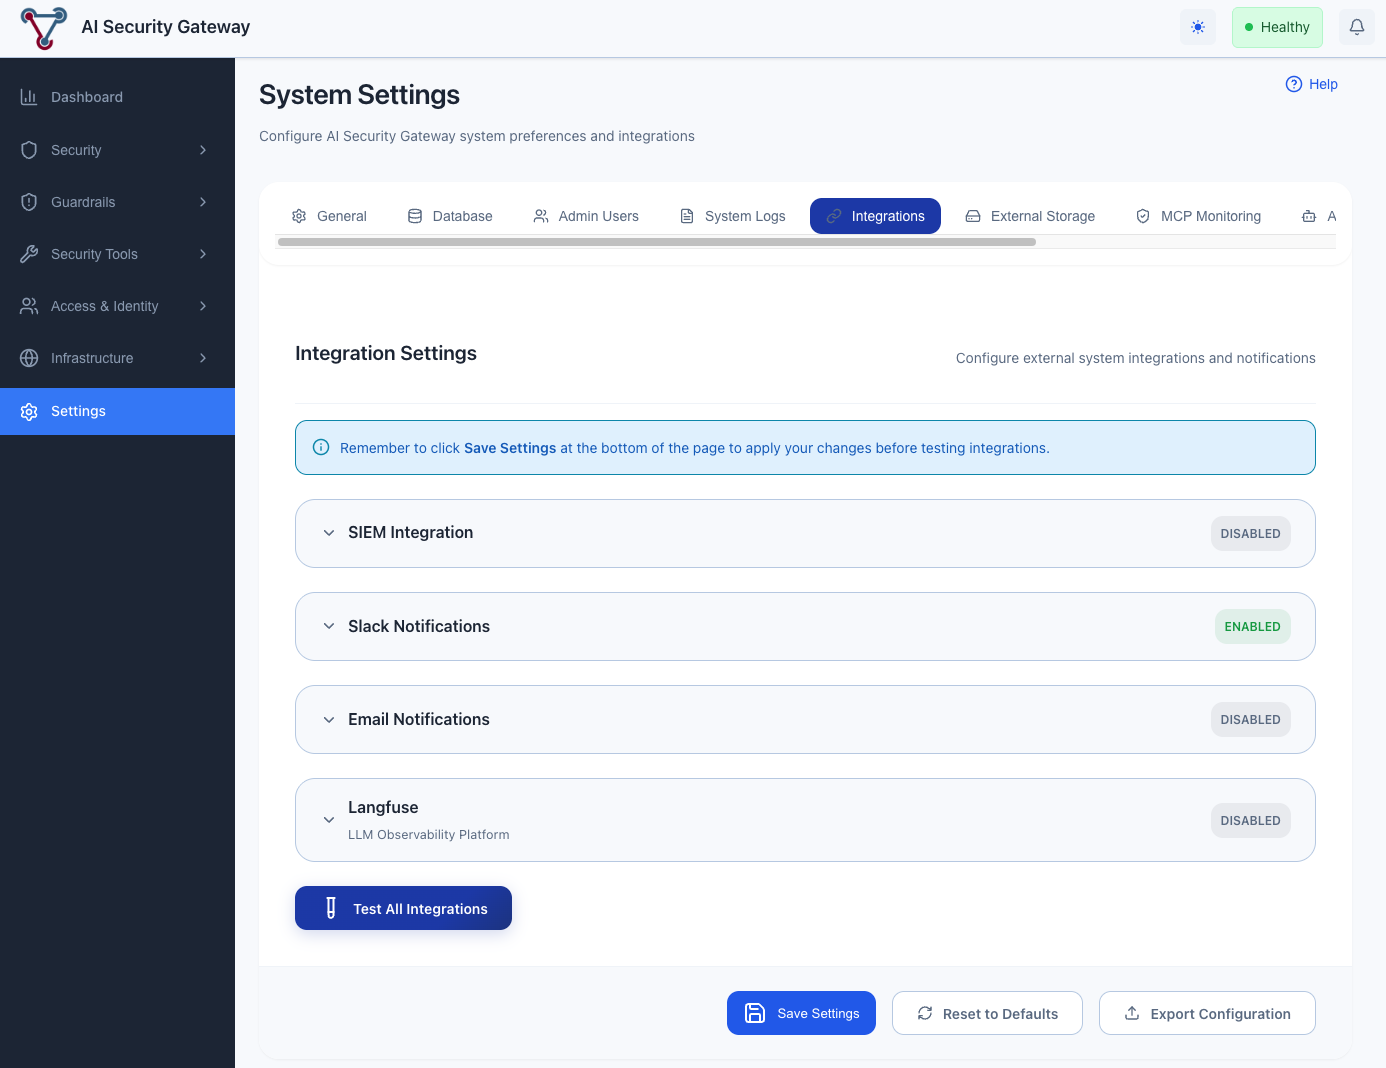 The Integrations tab provides a unified interface for configuring all external system integrations
Accessing Integration Settings
- Navigate to the AI Security Gateway Web UI (default: http://localhost:8080)
- Log in with your admin credentials
- Click Settings in the left navigation menu
- Select the Integrations tab
Each integration is displayed as a collapsible accordion card. Click on an integration header to expand it and access its configuration. From this interface, you can:
- Enable/disable each integration
- Configure connection settings
- Set severity thresholds and alert category filters
- Test connectivity
- View integration status
Configuration Overview
All integration settings are stored securely in the database and can be managed through the Web UI. Sensitive credentials (API keys, passwords) are encrypted at rest.
SIEM Integration
Supported SIEM Platforms
The AI Security Gateway can forward security events to any SIEM platform that supports HTTP-based event ingestion:
- Splunk: Via HTTP Event Collector (HEC)
- Elastic Stack: Via Elasticsearch REST API
- IBM QRadar: Via REST API endpoints
- ArcSight: Via HTTP receiver
- Generic SIEM: Any platform supporting JSON over HTTP
Configuring SIEM Integration
Via Web UI (Recommended):
- Navigate to Settings → Integrations
- Locate the SIEM Integration section
- Enable the integration toggle
- Configure the following settings:
- Endpoint: SIEM API endpoint URL (e.g.,
https://splunk.company.com:8088/services/collector) - API Key: Authentication token/key from your SIEM platform
- Index: Target index or destination for events
- TLS Verify: Enable/disable SSL certificate verification
- Endpoint: SIEM API endpoint URL (e.g.,
- Click Test Connection to verify settings
- Click Save Settings to apply changes
SIEM Setup Examples
Splunk HEC:
- In Splunk: Settings → Data Inputs → HTTP Event Collector
- Create new token with desired index (e.g.,
ai_security) - Copy the token and endpoint URL
- Enter in AI Security Gateway SIEM settings
Elastic Stack:
- Create API key:
POST /_security/api_key - Create index template for event storage
- Use endpoint format:
https://elasticsearch:9200/ai-security/_doc
IBM QRadar:
- Generate SEC token: Admin → Authorized Services
- Create custom event property for AI Security Gateway
- Configure log source for HTTP events
Slack Integration
Setup Overview
Slack integration provides real-time notifications for security alerts directly to your team's Slack channels.
Creating a Slack Webhook
Create Slack App:
- Go to https://api.slack.com/apps
- Click "Create New App" → "From scratch"
- Name: "AI Security Gateway"
- Select your workspace
Enable Incoming Webhooks:
- Navigate to "Incoming Webhooks"
- Turn on "Activate Incoming Webhooks"
- Click "Add New Webhook to Workspace"
- Select channel (e.g.,
#security-alerts) - Copy the webhook URL
Configure in AI Security Gateway:
- Navigate to Settings → Integrations
- Click the Slack Notifications accordion to expand it
- Enable the integration toggle
- Paste the webhook URL
- Configure channel name and display settings
- Set minimum severity level for notifications
- Select which Alert Categories to receive (see below)
- Click Test Connection to verify
- Click Save Settings
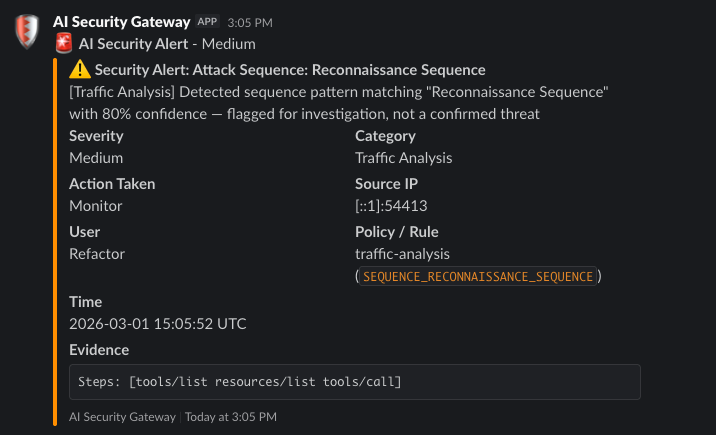
Slack Message Format
Alert notifications include:
- Severity (color-coded: 🔴 Critical, 🟠 High, 🟡 Medium, 🟢 Low)
- Category (e.g. Guardrails, Policy Violations, Canary Tokens)
- Alert Title and Description
- Action Taken (Block/Monitor)
- User Context — user display name and email (or "Anonymous")
- Source IP and Target proxy/endpoint
- Policy / Rule — policy name and rule ID
- Timestamp
- Evidence — truncated evidence excerpt
Severity Filtering
Configure the minimum severity level for Slack notifications:
CRITICAL: Only critical alertsHIGH: High and critical alertsMEDIUM: Medium, high, and critical alerts (recommended)LOW: All alerts (not recommended for production)
Alert Category Filtering
In addition to severity filtering, you can select which alert categories trigger Slack notifications. Both filters work together — an alert must pass both the severity threshold and have its category enabled to be sent.
Available categories:
| Category | Description |
|---|---|
| Guardrails | Guardrail violations and failures from third-party guardrail providers |
| Policy Violations | Blocked patterns, security rules, restricted method access |
| Canary Tokens | Canary token leakage detection |
| MCP Tool Changes | Tool addition, removal, or modification detected by the tool monitor |
| Tool Security | Disabled tool calls, per-tool rate limits, suspicious tool calls |
| Traffic Analysis | Behavioral anomalies, attack sequences, SSE security events |
| Content Security | Content redaction, information disclosure detection |
| Other | Uncategorized alerts (catch-all for future alert types) |
All categories are enabled by default. To reduce noise, disable categories that are not relevant to your Slack channel's audience.
Email Integration
Configuring Email Alerts
Via Web UI:
- Navigate to Settings → Integrations
- Click the Email Notifications accordion to expand it
- Enable the integration toggle
- Configure SMTP settings:
- SMTP Host: Your mail server hostname
- SMTP Port: Usually 587 (TLS) or 465 (SSL)
- SMTP Username: Email account username
- SMTP Password: Email account password or app password
- Use TLS: Enable for secure connections
- From Address: Sender email address
- Recipients: Comma-separated list of recipient emails
- Minimum Severity: Alert severity threshold
- Format: HTML or plain text
- Alert Categories: Select which categories trigger email notifications (same categories as Slack — see Alert Category Filtering above)
- Click Test Connection to verify settings
- Click Save Settings
Email Provider Setup Examples
Gmail:
- Enable 2-Step Verification: https://myaccount.google.com/security
- Generate App Password:
- Go to https://myaccount.google.com/apppasswords
- Select "Mail" and "Other (Custom name)"
- Name: "AI Security Gateway"
- Copy the 16-character password
- Use in AI Security Gateway:
- SMTP Host:
smtp.gmail.com - SMTP Port:
587 - Use TLS: Enabled
- Username: Your Gmail address
- Password: The 16-character app password
- SMTP Host:
Microsoft 365 / Outlook:
- SMTP Host:
smtp.office365.com - SMTP Port:
587 - Use TLS: Enabled
- Username: Your Microsoft 365 email
- Password: Your account password
SendGrid (API-based):
- SMTP Host:
smtp.sendgrid.net - SMTP Port:
587 - Use TLS: Enabled
- Username:
apikey - Password: Your SendGrid API key
Email Alert Format
Emails include:
- Subject:
[AI Security Alert] ${Severity}: ${Title} - HTML Body (if format: html):
- Color-coded severity banner
- Severity and alert category
- Alert description and action taken
- User Context — user display name and email
- Source & Target — source IP and target proxy/endpoint
- Policy Details — policy name and rule ID
- Timestamp
- Evidence excerpt (monospace block)
- Plain Text Body (if format: text):
- Severity, category, alert type, action, description
- User context section
- Source & target section
- Policy & rule section
- Timestamp and evidence
Langfuse Integration
Langfuse provides AI observability and tracing capabilities for monitoring LLM proxy interactions.
Via Web UI:
- Navigate to Settings → Integrations
- Locate the Langfuse Integration section
- Enable the integration toggle
- Configure connection settings:
- Public Key: Your Langfuse public key
- Secret Key: Your Langfuse secret key
- Host: Langfuse instance URL (default:
https://cloud.langfuse.com)
- Click Test Connection to verify settings
- Click Save Settings
For detailed Langfuse setup instructions, see the Langfuse Setup Guide.
Testing Integrations
Web UI Testing (Recommended)
- Navigate to Settings → Integrations
- Configure your integration settings
- Click the Test Connection button for the specific integration
- Review the test results displayed in the UI
- Check for success or error messages
The test will:
- Verify connectivity to the external system
- Validate authentication credentials
- Send a test event/message
- Report any configuration issues
Generating Test Alerts
To verify that integrations are working correctly, you can trigger test alerts:
- Create a test MCP or LLM proxy
- Configure it with a security policy
- Send a request that triggers a security alert
- Verify the alert appears in your integrated systems (SIEM, Slack, Email)
See the Quick Start Guide for detailed instructions on creating proxies and testing security policies.
Event Types Sent to Integrations
SIEM Events
- Security Alerts: Real-time security alerts from MCP and LLM proxies
- Proxy Status Changes: Proxy start/stop/restart events
- Authentication Events: OAuth login/logout, failed authentication attempts
- Configuration Changes: Policy updates, proxy configuration changes
- System Events: Backup completion, settings updates, integration status
Slack Notifications
- Real-time Security Alerts: Immediate notification for alerts above configured severity threshold
- Proxy Status Changes: Notifications for proxy lifecycle events
- Integration Status: Alerts when integrations fail or recover
Email Alerts
- Alert Notifications: Individual emails for each alert above configured severity threshold
- Critical Alerts: Immediate high-priority emails for critical issues
Integration Health Monitoring
Via Web UI
- Navigate to Settings → Integrations
- View status indicators for each integration:
- 🟢 Healthy: Integration is working correctly
- 🟡 Degraded: Integration is experiencing issues
- 🔴 Failed: Integration is not functioning
- Click on an integration to view:
- Recent activity logs
- Error messages
- Connection statistics
- Last successful test time
Monitoring Best Practices
- Regularly test integrations using the built-in test functionality
- Monitor the Settings → Integrations page for status changes
- Review system logs for integration-related errors
- Set up monitoring alerts for integration failures
Troubleshooting
Common Issues
Authentication Failures:
- Verify API keys and credentials are correct
- Check that endpoint URLs are accessible
- Ensure service accounts have proper permissions
- Test credentials directly with the external service
Network Connectivity:
- Verify the endpoint URL is reachable from your server
- Check firewall rules and network policies
- Ensure SSL/TLS certificates are valid
- Test connectivity using curl or similar tools
Integration Not Receiving Events:
- Verify the integration is enabled in Settings → Integrations
- Check that the minimum severity threshold is appropriate
- Verify that the relevant alert categories are enabled for the integration
- Review recent test results for errors
- Ensure proxies are configured with security policies that generate alerts
Viewing Integration Logs
Integration activity and errors are logged in the system audit logs:
- Navigate to Settings → System Logs
- Filter by event type: "integration"
- Review recent integration attempts and errors
- Check timestamps and error messages for troubleshooting
Getting Help
If you continue to experience issues:
- Check the integration status indicators in Settings → Integrations
- Review the system logs for detailed error messages
- Verify your external service configuration (SIEM, Slack, email server)
- Test the integration using the built-in test functionality
Best Practices
- Start with Test Connections: Always test integrations before relying on them in production
- Set Appropriate Severity Thresholds: Avoid alert fatigue by filtering to relevant severities
- Use Alert Category Filtering: Disable categories that are not relevant to a particular notification channel (e.g., disable "Traffic Analysis" for a channel focused on guardrail violations)
- Monitor Integration Health: Regularly check the Integrations page for status updates
- Secure Credentials: Never commit API keys or passwords to version control
- Review Logs Periodically: Check integration logs to ensure events are being sent correctly
- Use Dedicated Service Accounts: Create specific accounts for the AI Security Gateway with minimal required permissions