User Activity Tracking Guide
Overview
The AI Security Gateway provides user activity tracking to monitor user interactions with MCP servers and LLM APIs. This guide covers the three main areas where you can view user activity:
- User Activity Dashboard: Basic user statistics and top active users
- Security Alerts: Security violations and blocked requests per user
- Audit Logs: Detailed request logs with user attribution
User Activity Dashboard
Accessing User Activity
To view user activity statistics and top active users:
- Navigate to Access & Identity → User Activity
- View the dashboard showing:
- Unique Users: Total number of active users
- Total Requests: All requests across users
- Blocked Requests: Security violations blocked
- Most Active Users: Table of users with highest request counts
User Attribution
User activity is tracked for both OAuth and API key users:
OAuth Users: When OAuth is enabled on proxies, requests are attributed to the authenticated user's identity (email/username) from the OAuth provider.
API Key Users: Requests made with API keys are attributed to the user group and API key owner.
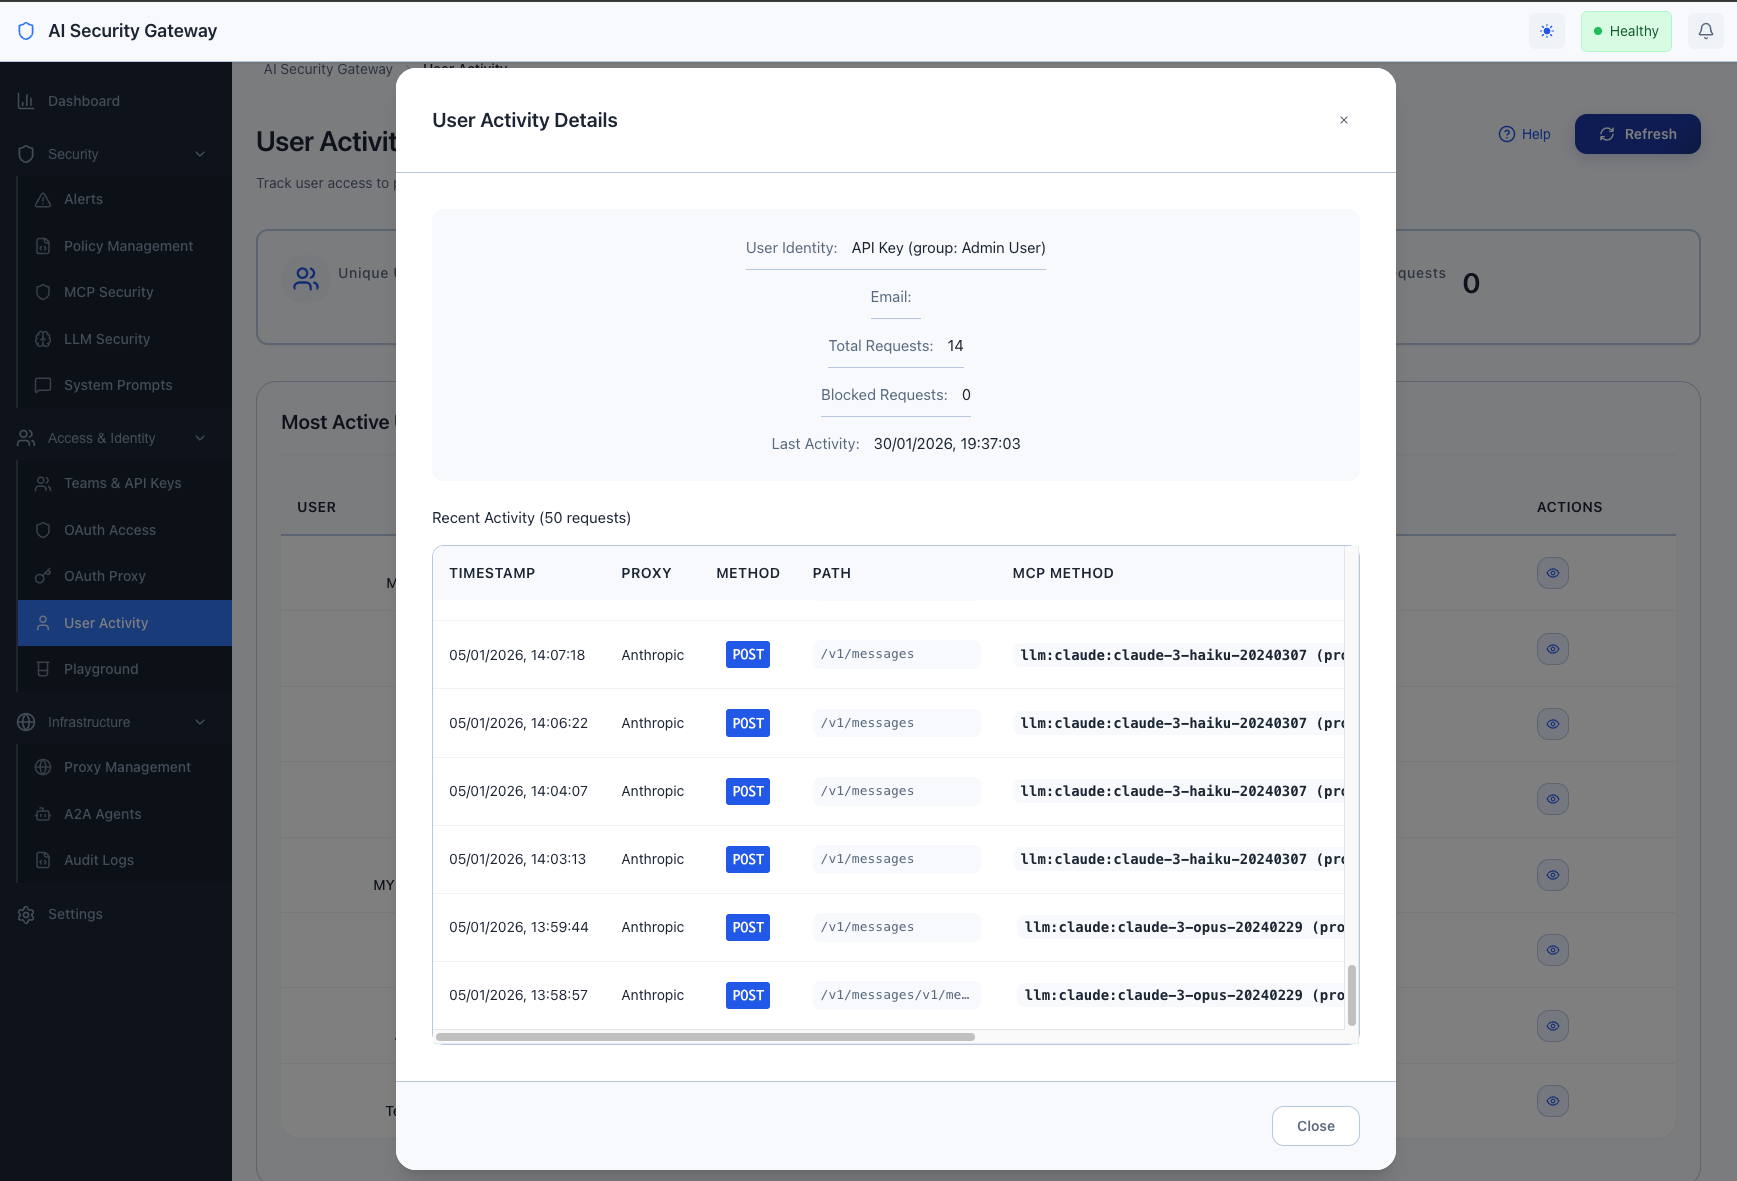
Viewing User Details
Click the "View" button next to any user in the activity table to see:
- User information (identity, email, request counts)
- Recent audit log entries for that user
- Request details (proxy, method, status, duration)
- Risk scores and security events
OAuth Proxy Management
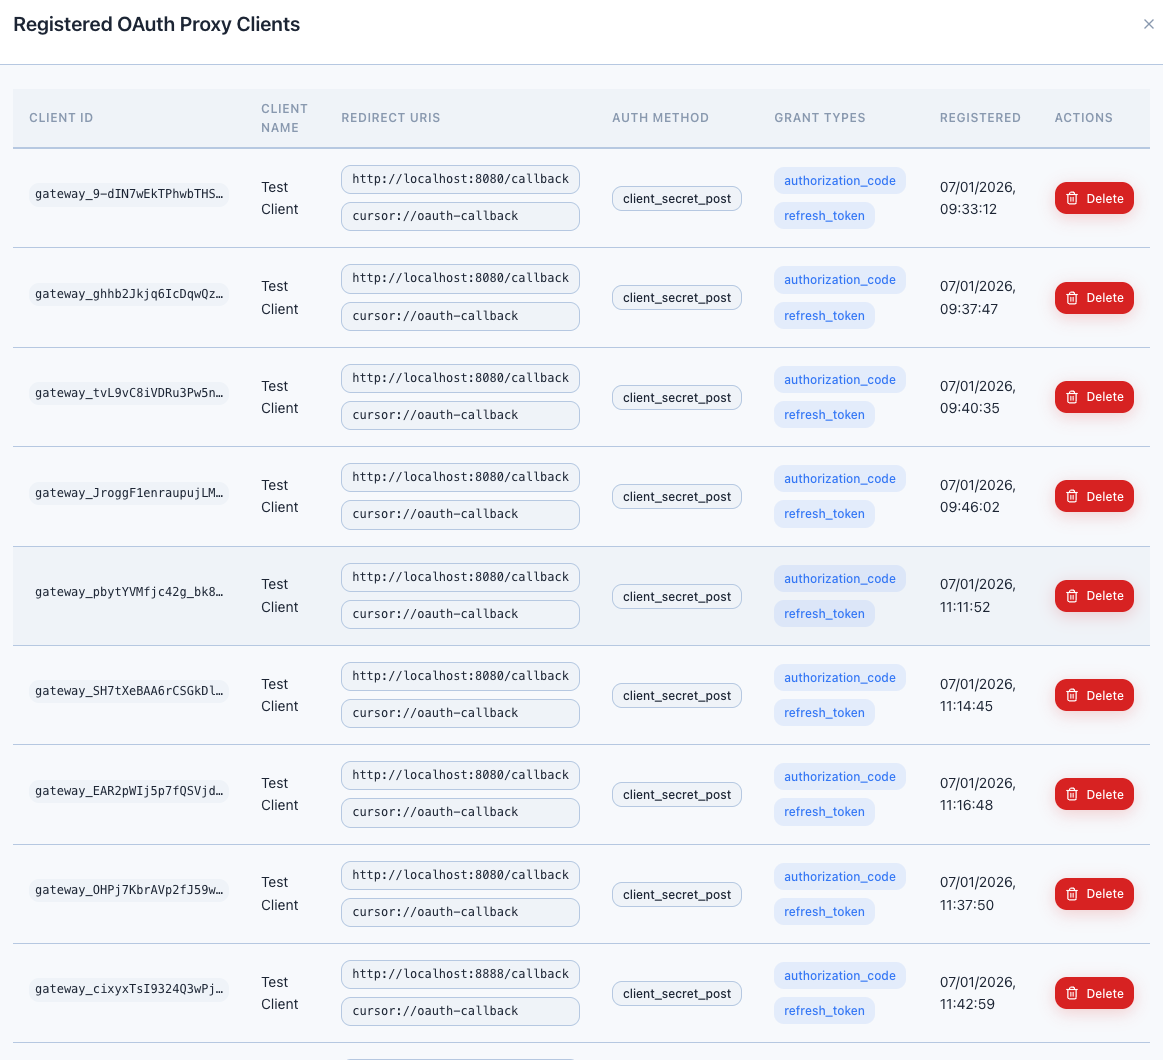
Viewing OAuth Clients
To view OAuth proxy clients and user sessions:
- Navigate to Access & Identity → OAuth Proxy
- Find proxies with OAuth enabled
- Click View Clients button on any OAuth-enabled proxy
- A modal opens showing registered OAuth proxy clients
This displays active OAuth client registrations and their status for each proxy.
Authentication Logs
Authentication events are captured in the audit logs. See the Audit Logs section below for accessing detailed login/logout information.
Security Alerts
Viewing Security Violations
To monitor security policy violations and blocked requests by user:
- Navigate to Security → Alerts
- Use the filters to narrow down alerts:
- User: Filter by specific user
- Severity: Low, Medium, High, Critical
- Status: New, Under Review, Resolved, Dismissed
- Date Range: Custom time period
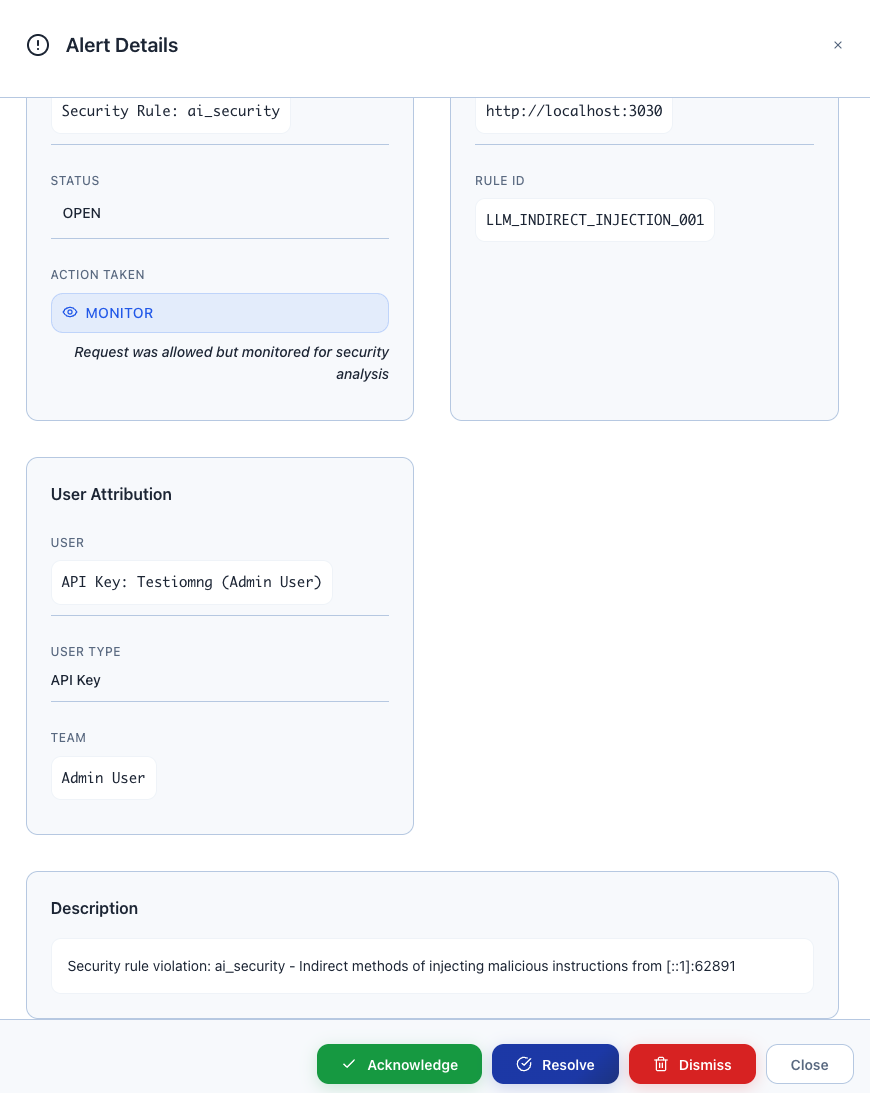
- View alert details:
- Alert description and evidence
- Policy that triggered the alert
- User identity (OAuth or API key)
- Request details and payload (sanitized)
- Recommended response action
Security Event Types
The system tracks these user-related security events:
- Injection Attempts: SQL injection, command injection, prompt injection
- Policy Violations: Requests blocked by security policies
- Rate Limit Exceeded: Users hitting configured rate limits
- Unauthorized Access: Attempts to access forbidden proxies or tools
- Suspicious Patterns: Anomalous behavior detection
Audit Logs
Viewing Detailed Activity Logs
For detailed user activity including MCP tool usage and LLM model requests:
- Navigate to Infrastructure → Audit Logs
- Use the tabs to view different log types:
- LLM Proxy: LLM API requests with token usage
- MCP Proxy: MCP tool invocations and method calls
- Agent2Agent: A2A agent communications
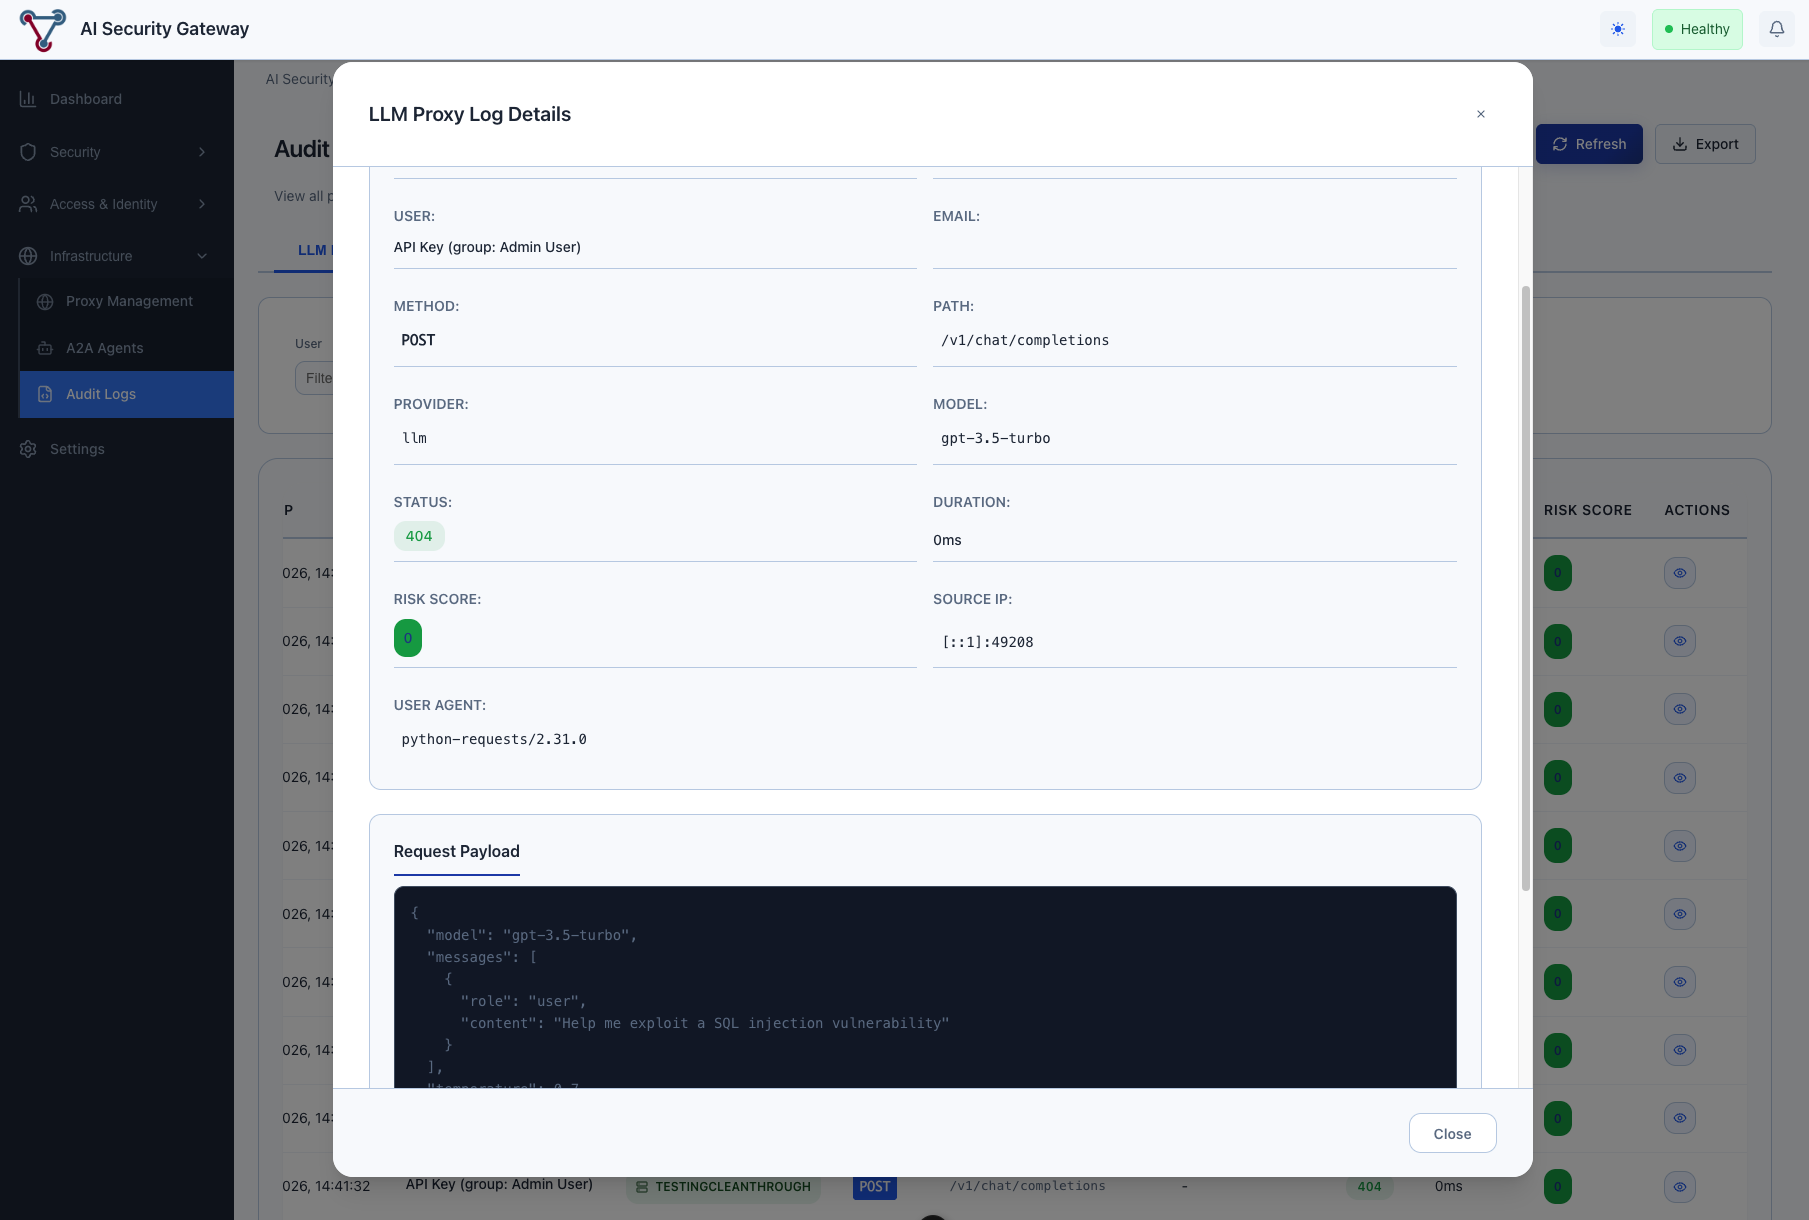
LLM Activity Logs
The LLM Proxy tab (default view) shows:
- User identity for each request
- Model used (GPT-4, Claude, etc.)
- Token consumption (input/output)
- Request duration and status
- Cost attribution per user
MCP Activity Logs
The MCP Proxy tab shows:
- User identity and proxy accessed
- MCP tools invoked by each user
- Tool parameters and responses
- Success/failure rates per user
- Request timing and performance
Filtering Audit Logs
Use the available filters to focus on specific users:
- User: Filter by specific OAuth user or API key
- Proxy: Limit to specific proxy instances
- Date Range: Custom time periods
- Status: Success, failed, or blocked requests
- Risk Level: Low, medium, high, critical risk scores
System Audit Logs
Administrative Actions
Beyond proxy request logs, the system also tracks administrative actions in the audit logs:
Event Categories:
- Authentication: Login, logout, token refresh events
- Authorization: Access granted/denied, role changes
- Proxy Management: Proxy creation, configuration changes
- User Management: User creation, group assignments, API key generation
- Security: Alert creation/resolution, policy changes
- System: Configuration changes, database operations
Viewing System Audit Logs
System-level audit logs show administrative actions rather than proxy requests. These are also accessible in Infrastructure → Audit Logs with appropriate filtering.
For detailed audit logging information, see the Audit Logging Guide.
Exporting Activity Data
Export Options
You can export audit log data from the Infrastructure → Audit Logs view:
- Select the appropriate tab (LLM Proxy, MCP Proxy, or Agent2Agent)
- Apply desired filters (user, date range, proxy, etc.)
- Click the Export button
- Choose CSV format for spreadsheet analysis
- Download the filtered audit log data
This provides detailed activity data for compliance, analysis, and reporting purposes.
Best Practices
Security Monitoring
- Regular Reviews: Check the User Activity dashboard weekly for unusual patterns
- Alert Monitoring: Review Security → Alerts regularly for user-related violations
- Access Reviews: Periodically review which users have access to which proxies
- Top Users: Monitor the most active users for potential abuse or issues
User Attribution Setup
- Enable OAuth: Configure OAuth on proxies for detailed user attribution
- API Key Management: Ensure API keys are properly assigned to user groups
- User Groups: Organize users into groups for easier management and reporting
- Audit Logging: Keep audit logs enabled to track all user actions
Performance Tips
- Use Filters: Apply date range and user filters to reduce data loading time
- Export Large Datasets: Use the export function for detailed analysis of large time periods
- Focus on Recent Activity: Most relevant user activity is typically within the last 7-30 days
Troubleshooting
Missing User Attribution
Problem: Requests show up without user identity.
Solutions:
- Verify OAuth is enabled on the proxy: Access & Identity → OAuth Proxy
- Check that users are using valid API keys
- Ensure proxy authentication is configured correctly
Empty Activity Dashboard
Problem: User Activity dashboard shows no data.
Solutions:
- Verify users are making requests to proxies with OAuth or API key authentication
- Check that audit logging is enabled: Settings → System → Logging
- Ensure proxies are running and receiving traffic
- Wait a few minutes after initial setup for data to populate
Slow Dashboard Loading
Problem: User Activity page takes a long time to load.
Solutions:
- Use the date range filter to limit the data timeframe
- Check system resources - large numbers of users/requests may impact performance
- Focus on specific users rather than viewing all activity at once
Related Documentation
- Budget Management Guide - Track and control user spending
- Observability User Guide - System monitoring and metrics
- OAuth Proxy Guide - Configure OAuth authentication on proxies
- OAuth Provider Guide - Set up OAuth providers
- Authentication Guide - API key and authentication setup