Langfuse Integration Setup Guide
Langfuse Overview
Langfuse is an open-source LLM observability platform that provides specialized monitoring, prompt management, and analytics for LLM applications. This guide walks you through setting up Langfuse integration with the AI Security Gateway.
Important: Langfuse telemetry (tracing) operates independently of audit logging. This means:
- ✅ Traces are sent to Langfuse even if audit logging is disabled for a proxy
- ✅ You can disable audit logs for performance/compliance while maintaining observability
- ✅ Audit logs (database) and traces (Langfuse) have separate retention policies
- ✅ Use Langfuse for monitoring without storing detailed audit logs locally
Why Use Langfuse?
Langfuse provides several advantages over generic observability tools:
- LLM-Specific UI: Pre-built dashboards designed for LLM workflows
- Prompt Management: Version control and A/B testing for prompts
- Cost Analysis: Detailed cost breakdowns per conversation and feature
- Quality Metrics: Evaluation workflows and feedback collection
- Session Tracking: Multi-turn conversation tracking and analytics
Langfuse Prerequisites
- AI Security Gateway installed and running
- Langfuse account (cloud) or self-hosted Langfuse instance
- Langfuse project with API keys
Quick Setup (Web UI)
Step 1: Get Langfuse API Keys
For Langfuse Cloud:
- Go to https://cloud.langfuse.com
- Sign up for a free account (if you don't have one)
- Create a new project or select an existing project
- Navigate to Settings → API Keys
- Copy your Public Key (starts with
pk-lf-...) - Copy your Secret Key (starts with
sk-lf-...) - Important: Keep your secret key secure - never expose it in client-side code
For Self-Hosted Langfuse:
- Access your Langfuse instance (see Self-Hosted Setup below)
- Create a project
- Navigate to Settings → API Keys
- Copy your Public and Secret keys
Step 2: Configure in AI Security Gateway Web UI
- Open the AI Security Gateway Web UI (default: http://localhost:8080)
- Navigate to Settings → Integrations
- Locate the Langfuse Integration section
- Enable the integration toggle
- Configure the following settings:
- Endpoint: Langfuse endpoint URL
- For Langfuse Cloud:
https://cloud.langfuse.com - For self-hosted (standard OTLP port):
http://langfuse:4318 - For self-hosted (web interface port):
http://langfuse:3000
- For Langfuse Cloud:
- Public Key: Paste your Langfuse public key (pk-lf-...)
- Secret Key: Paste your Langfuse secret key (sk-lf-...)
- Endpoint: Langfuse endpoint URL
- Click Test Connection to verify the configuration
- Click Save Settings to apply changes
The integration is now active - no restart required!
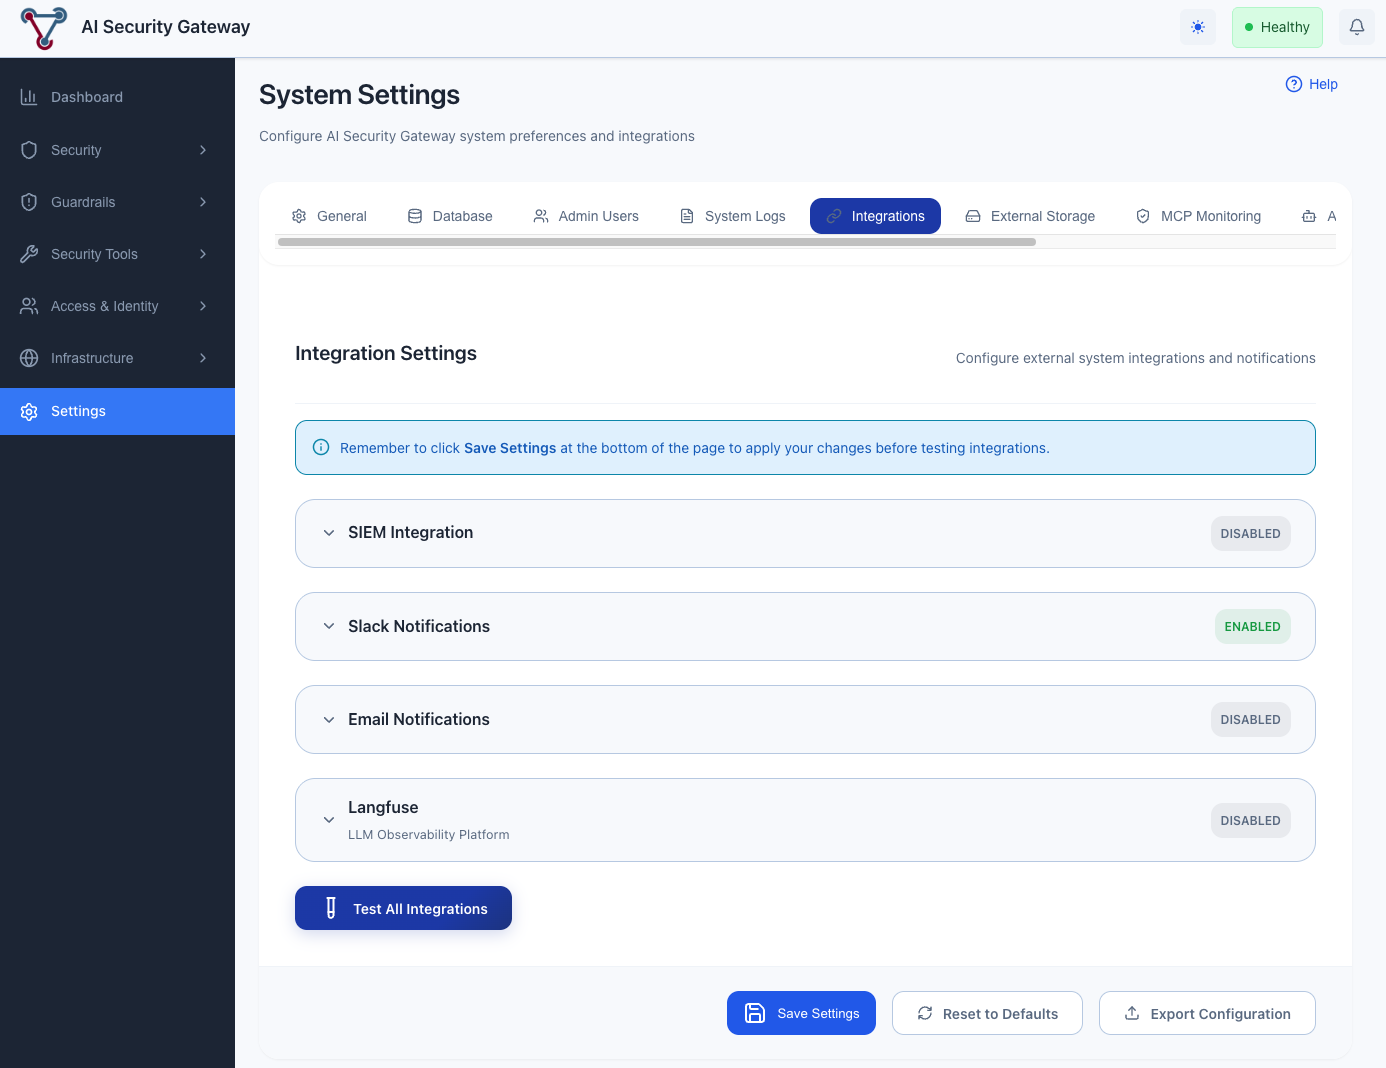 Configure Langfuse integration through the Web UI Settings → Integrations page
Self-Hosted Langfuse (Optional)
For self-hosted deployments, you can run Langfuse on your own infrastructure.
Deploy Langfuse
Follow the Langfuse self-hosting guide to deploy Langfuse.
OTLP Endpoint Configuration
Langfuse accepts OTLP traces via the /api/public/otel/v1/traces endpoint. The gateway automatically formats the endpoint path based on the port you specify:
Standard OTLP port (4318): Uses default path
/v1/traces- Example:
http://langfuse:4318→http://langfuse:4318/v1/traces
- Example:
Custom port (e.g., 3000): Appends
/api/public/otel/v1/traces- Example:
http://langfuse:3000→http://langfuse:3000/api/public/otel/v1/traces
- Example:
Configure in Web UI
Once your self-hosted Langfuse is running:
- Get your API keys from your Langfuse instance (Settings → API Keys)
- Follow the Web UI configuration steps above
- Use your self-hosted endpoint URL (e.g.,
http://langfuse:4318orhttp://langfuse:3000)
Testing the Integration
Via Web UI (Recommended)
- Navigate to Settings → Integrations
- Locate the Langfuse integration section
- Click Test Connection to verify the configuration
- Review the test results:
- ✅ Success: Configuration is valid and endpoint is reachable
- ❌ Failed: Check the error message and verify your settings
Via Test Request
Send a test LLM request through your proxy to verify traces are being sent:
curl -X POST http://localhost:8080/proxy/llm/v1/chat/completions \
  -H "Content-Type: application/json" \
  -H "Authorization: Bearer your-api-key" \
  -d '{
    "model": "gpt-4",
    "messages": [
      {"role": "user", "content": "Hello, this is a test message"}
    ]
  }'
Then check your Langfuse UI (Traces section) - you should see a trace appear within a few seconds.
Viewing Traces in Langfuse
After making requests through your LLM proxies:
- Open your Langfuse project in a browser
- Navigate to Traces section
- You should see a trace for your test request within a few seconds
- Click on the trace to view details:
- Request/response data
- Token usage
- Cost information
- Security context (risk level, violations)
- Model parameters
Using Langfuse Features
Viewing Traces
- Navigate to Traces: Click "Traces" in the Langfuse sidebar
- Filter Traces: Use filters to find specific traces:
- By model
- By proxy name
- By risk level
- By date range
- View Details: Click on a trace to see:
- Full prompt and response
- Token usage breakdown
- Cost calculation
- Security metadata
- Performance metrics
Analyzing Costs
- Navigate to Analytics: Click "Analytics" in the sidebar
- View Cost Breakdown: See costs by:
- Model
- Proxy
- Time period
- User/team
- Set Budgets: Configure budget alerts in Langfuse
Prompt Management
- Navigate to Prompts: Click "Prompts" in the sidebar
- Create Prompt Templates: Define reusable prompt templates
- Version Control: Track prompt changes over time
- A/B Testing: Compare different prompt versions
Evaluations
- Navigate to Evaluations: Click "Evaluations" in the sidebar
- Create Scorecards: Define evaluation criteria
- Run Evaluations: Automatically evaluate traces
- Collect Feedback: Gather human feedback on responses
Langfuse Next Steps
After setting up Langfuse:
- Explore Traces: Review traces in Langfuse UI to understand data structure
- Set Up Dashboards: Create custom dashboards for your use cases
- Configure Alerts: Set up alerts for cost, errors, or security issues
- Integrate Evaluations: Set up evaluation workflows for quality monitoring
- Manage Prompts: Create and version prompt templates
Langfuse Resources
- Langfuse Documentation
- Langfuse OpenTelemetry API Reference
- Langfuse Cloud
- OpenTelemetry Documentation
- AI Security Gateway Observability Guide
Langfuse Support
If you encounter issues:
- Check this guide's troubleshooting section
- Review gateway logs for errors
- Check Langfuse documentation
- Open an issue on the gateway GitHub repository